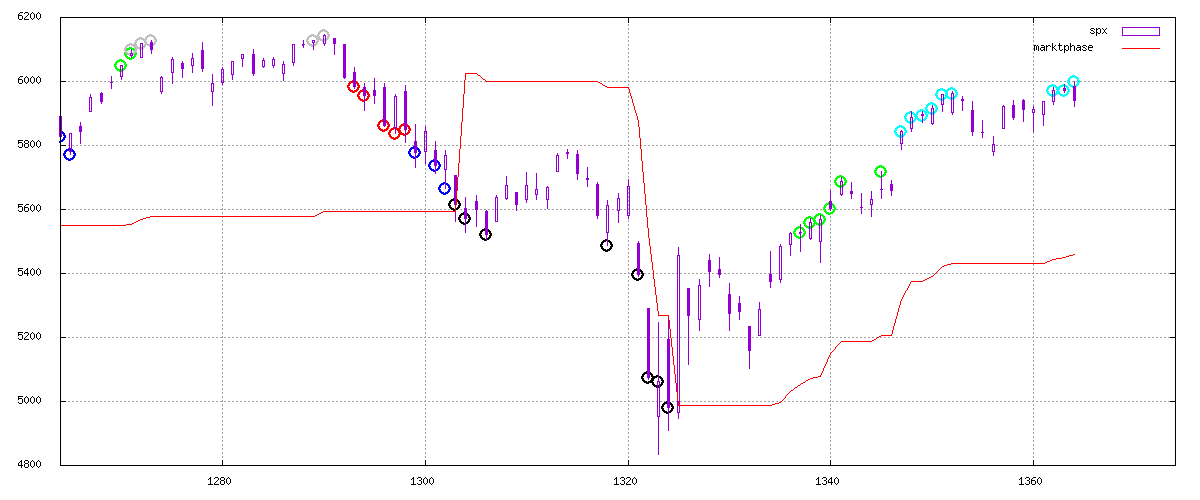
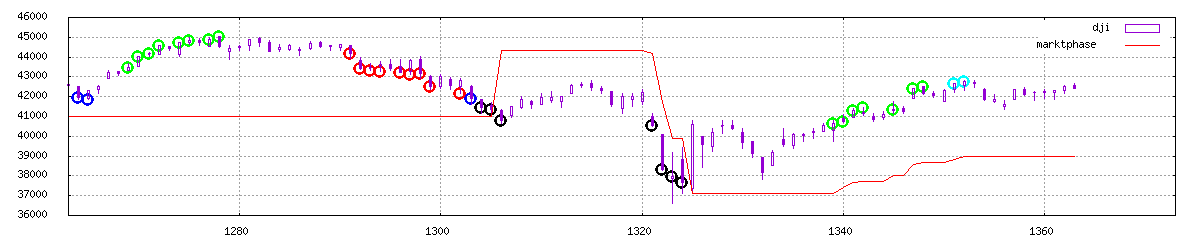
Marktphasenbestimmung:<=20: jung, >20:nachhaltig, >200:reif
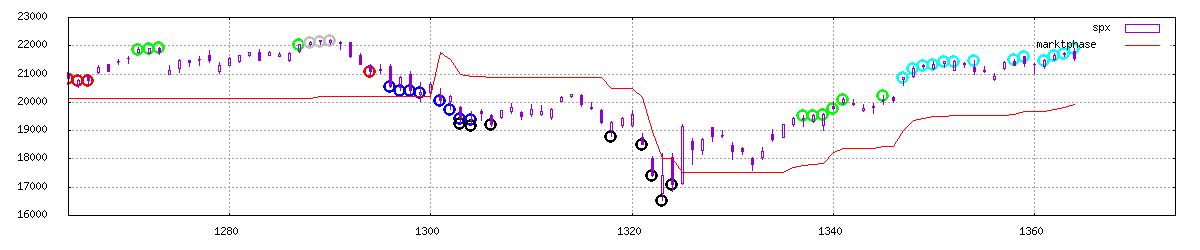
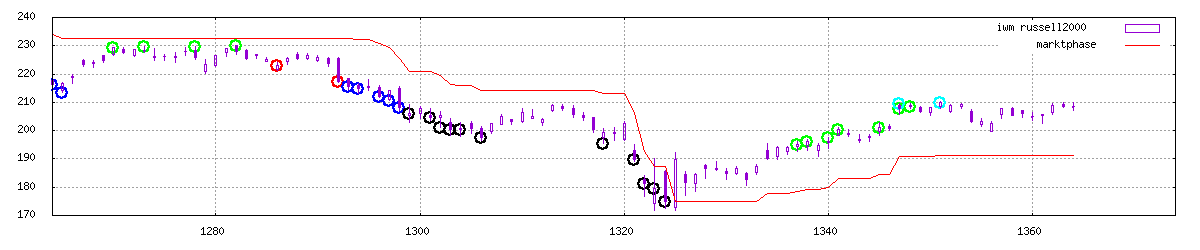
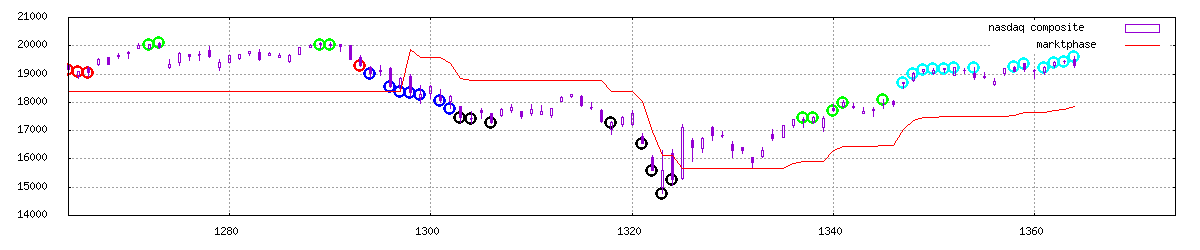
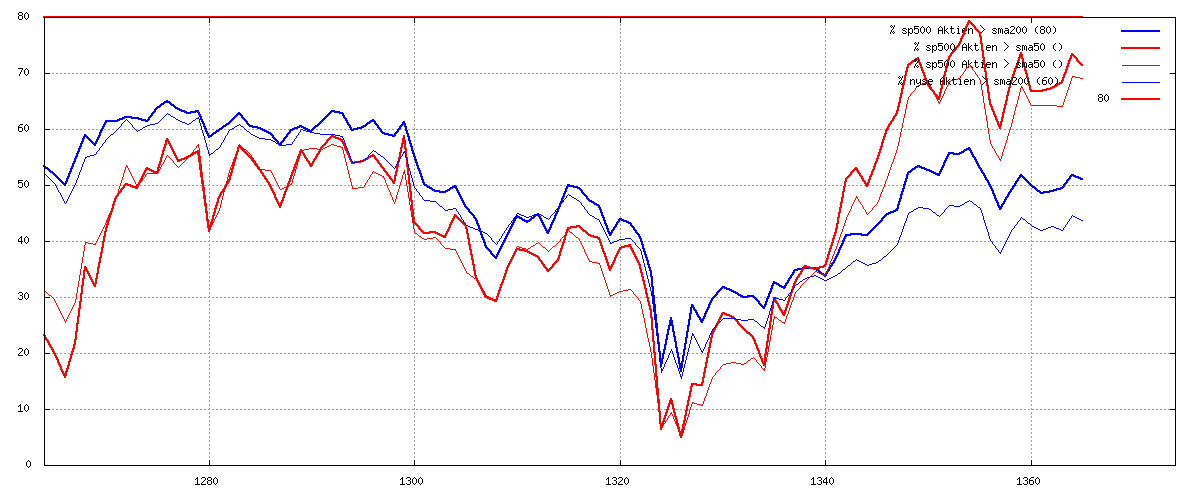
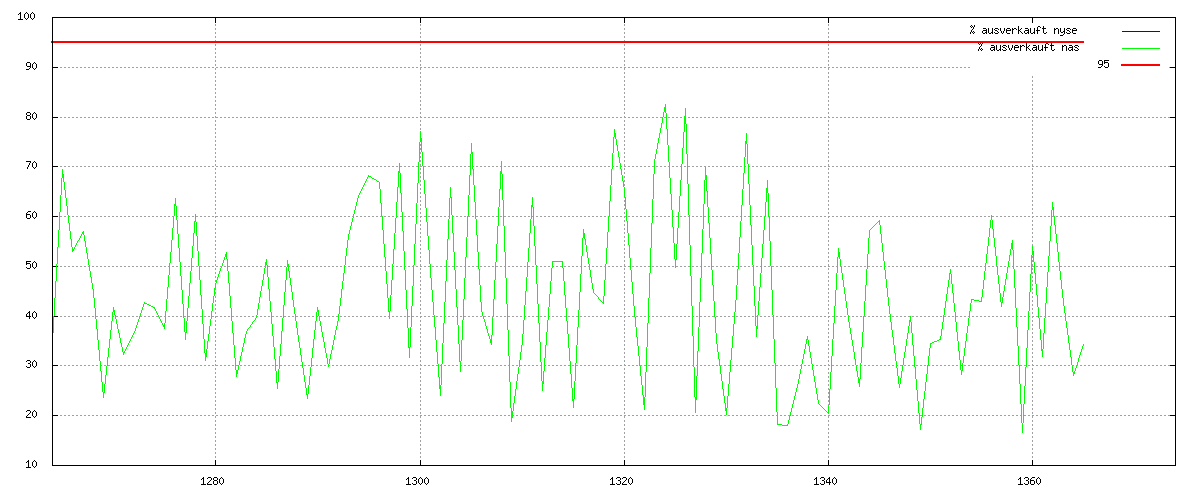
80% der S&P500 Aktien muessen ueber sma200 liegen, aber hoechstens 65 Tage.
Aktuell (2026-07-24): 0 Tage ueber 80 %
sp500:66.2 / 61.8
nyse :56.9 / 55.4
Datenquelle: stockcharts.com
$NYA200R und $SPXA200R
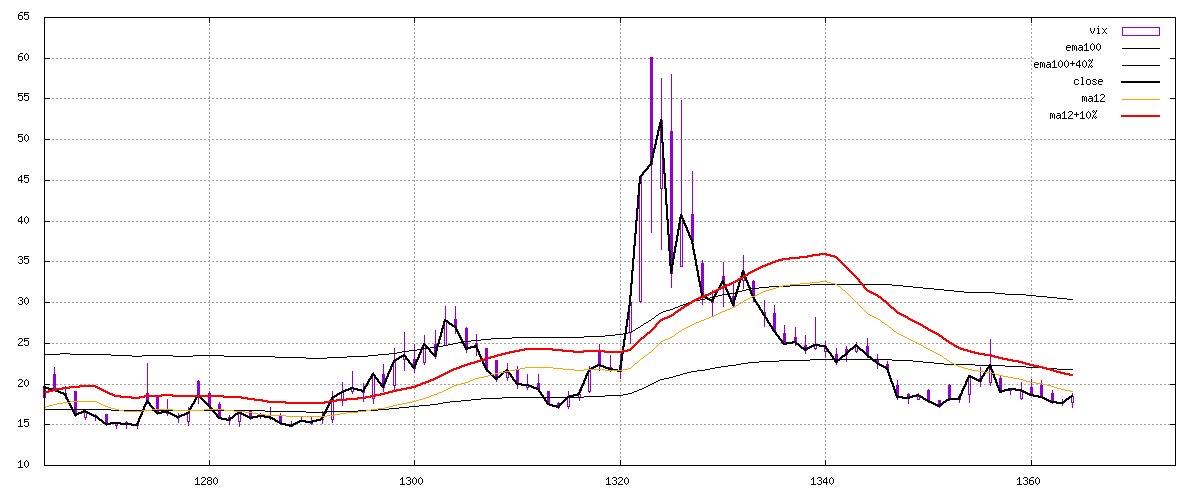
Signal bei:
17Tage Tief
gd12(vix)>10%Strechband
neues 17 oder 43 Tage Tief
ausser gd100(vix)>40%Strechband
Datenquelle: stockcharts.com
$vix
close: 2...3 und neues 17 Tage Tief
close > 3 und kurzfristiger Trend abwaerts
Datenquelle: stockcharts.com
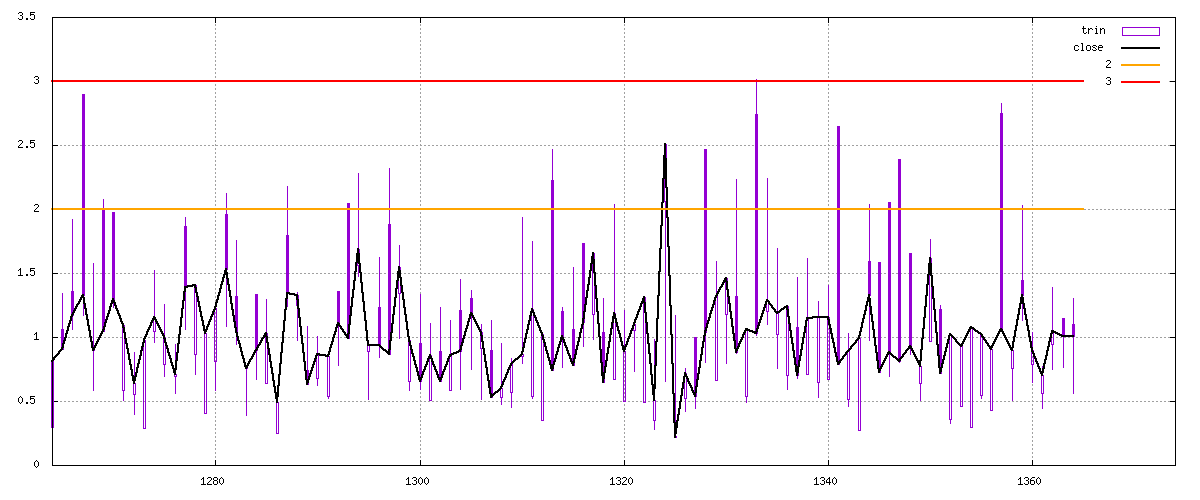
$trin
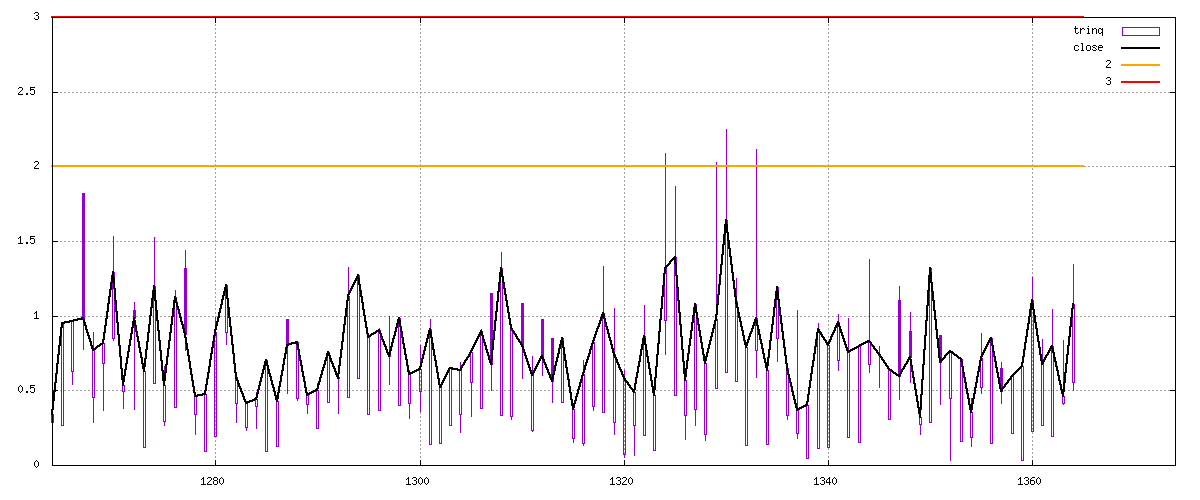
close: 2...3 und neues 17 Tage Tief
close > 3 und kurzfristiger Trend abwaerts
Datenquelle: stockcharts.com
$trinq
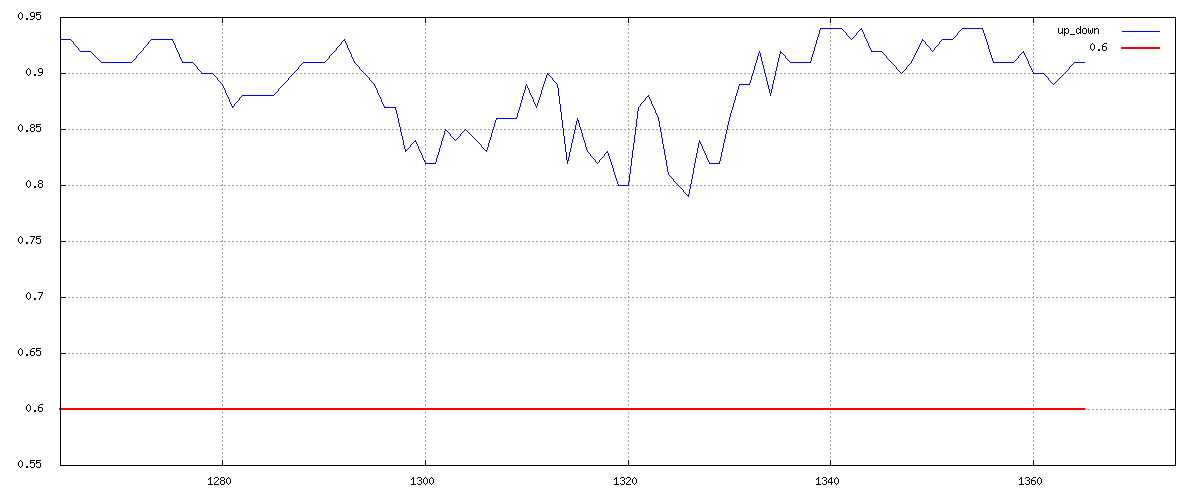
= GD5 von (sumUp NYSE+sumUP NAS)/(sumDown NYSE+sumDown NAS)
Signal bei: < 0.6 und 17Tage Tief
stockcharts:
$NYUPV, $NYDNV, $NAUPV, $NADNV
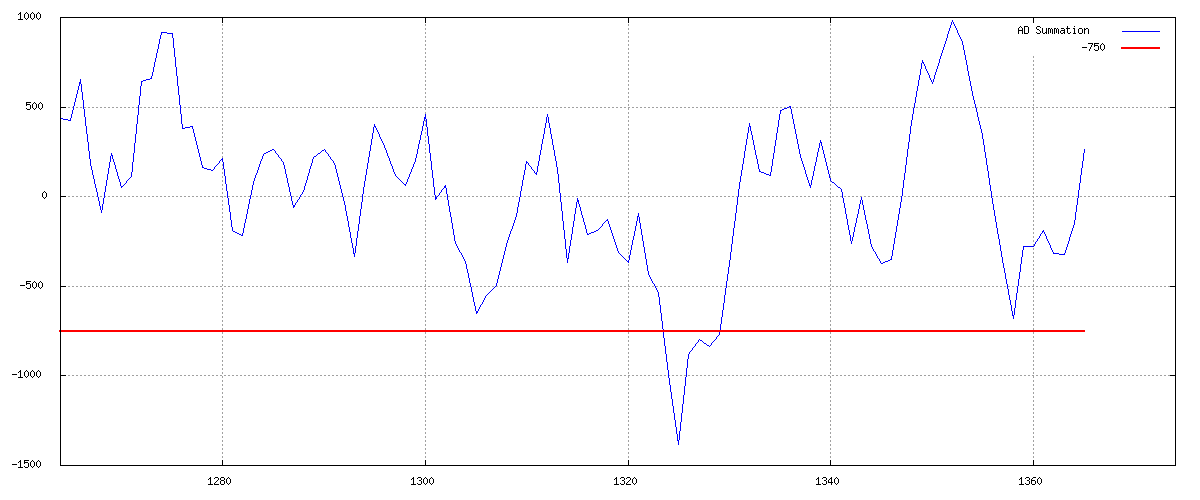
Summe ueber Periode 5 (Adv Issues NYSE + Adv Issues NAS - Dec Issues Nyse - Dec Issues NAS)/(2*5)
Signal, wenn < -750 und 17Tage Tief
Datenquelle: stockcharts.com
$NYADV=NYSE - Issues Advancing, $NYDEC=NYSE - Issues Declining, $NYADU=NYSE - Issues Unchanged
$NAADV=Nasdaq - Issues Advancing, $NADEC=Nasdaq - Issues Declining, $NAADU=Nasdaq - Issues Unchanged
100*GD5(52wH-52wL)/(AdvIssuesNYSE+DecIssuesNYSE+UNCHIssuesNYSE)
< 15 aber > als Vortag
langfristig abwaerts, am Vortag ein 43-Tage Tief
nachhaltig, aber oft zu spaet Datenquelle: stockcharts.com
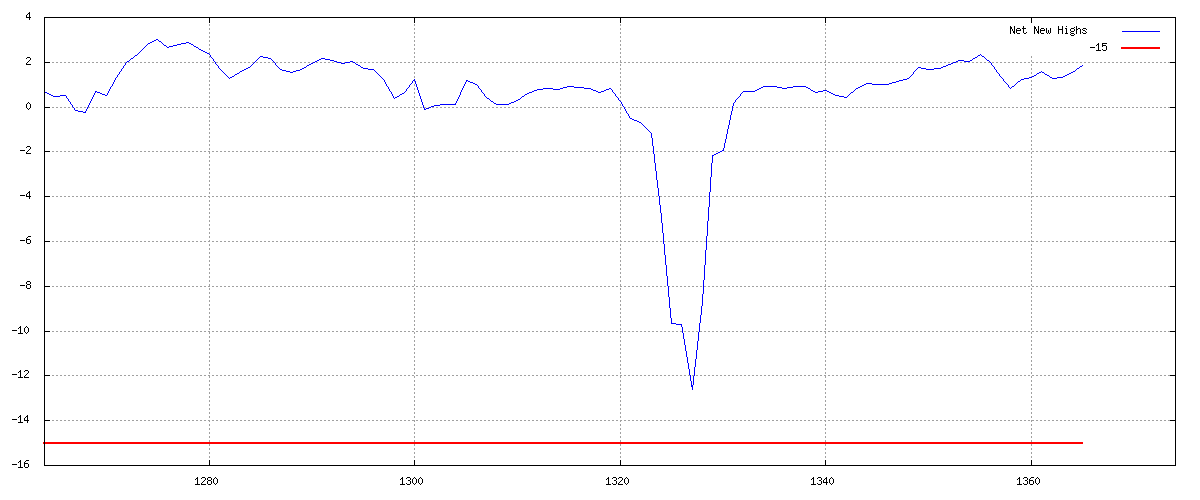
$NYHGH=NYSE - New 52-Week Highs
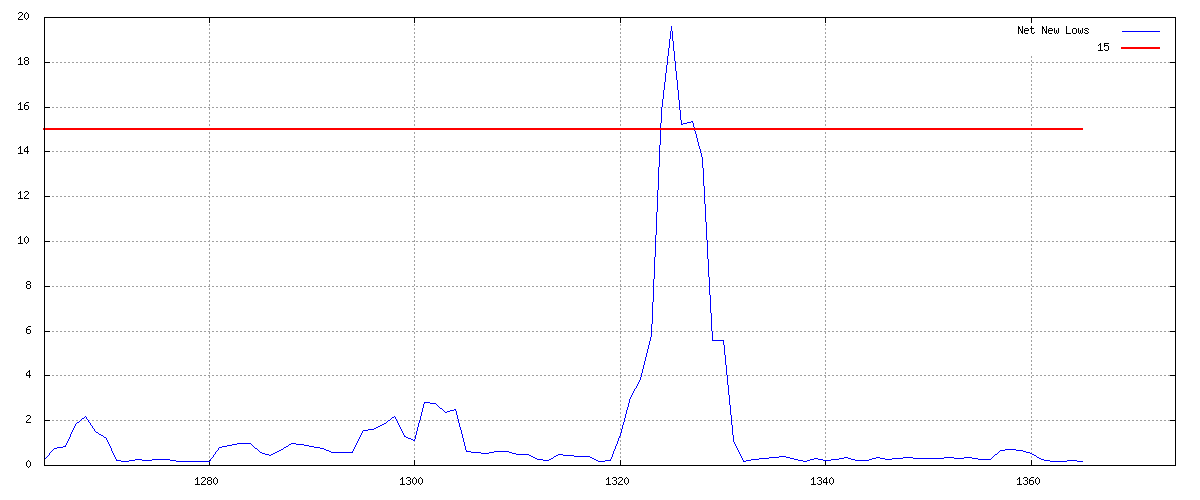
> 15%, im Baerenmarkt > 20% und im Baerenmarkt > 90 Tage 25%
100*GD(52wL/(Adv+Dec+Unc), x) mit x=2
Datenquelle: stockcharts.com
$NYLOW=NYSE - New 52-Week Lows
aktuell sp500 am 2026-07-24: 100.00
stockcharts:
$NYDPV/($NYUPV+$NYDNV)